Growth Model Sheet & Forecast That I Use
Navigating the complexities of substantial growth, strategic planning, and predictive modeling can be a challenging endeavor for many organizations. The goal is to meticulously map out your current growth trajectory, model how it works, accurately forecast alternative scenarios, and ultimately deliver additional value to your company.
The Growth Model Sheet is a dynamic tool that has significantly enhanced our ability to steer growth initiatives at SelectHub with greater clarity and precision. This tool serves as a comprehensive roadmap that allows you to dissect the components of growth, make forecasts, and pinpoint the critical levers necessary for accelerating your business.
- Scenario Planning & Experimentation: Use the Growth Model Sheet to visualize various growth scenarios. Engaging in strategic experimentation helps identify the most influential factors, guiding resource allocation.
- Sensitivity Analysis: The tool distinguishes the most impactful factors in your growth strategy through sensitivity analysis. Adjusting variables and assessing their impact offers invaluable insights for time and resource allocation.
- Roadmap: Utilize it to map out your growth through various programs across the year.
How to go through it
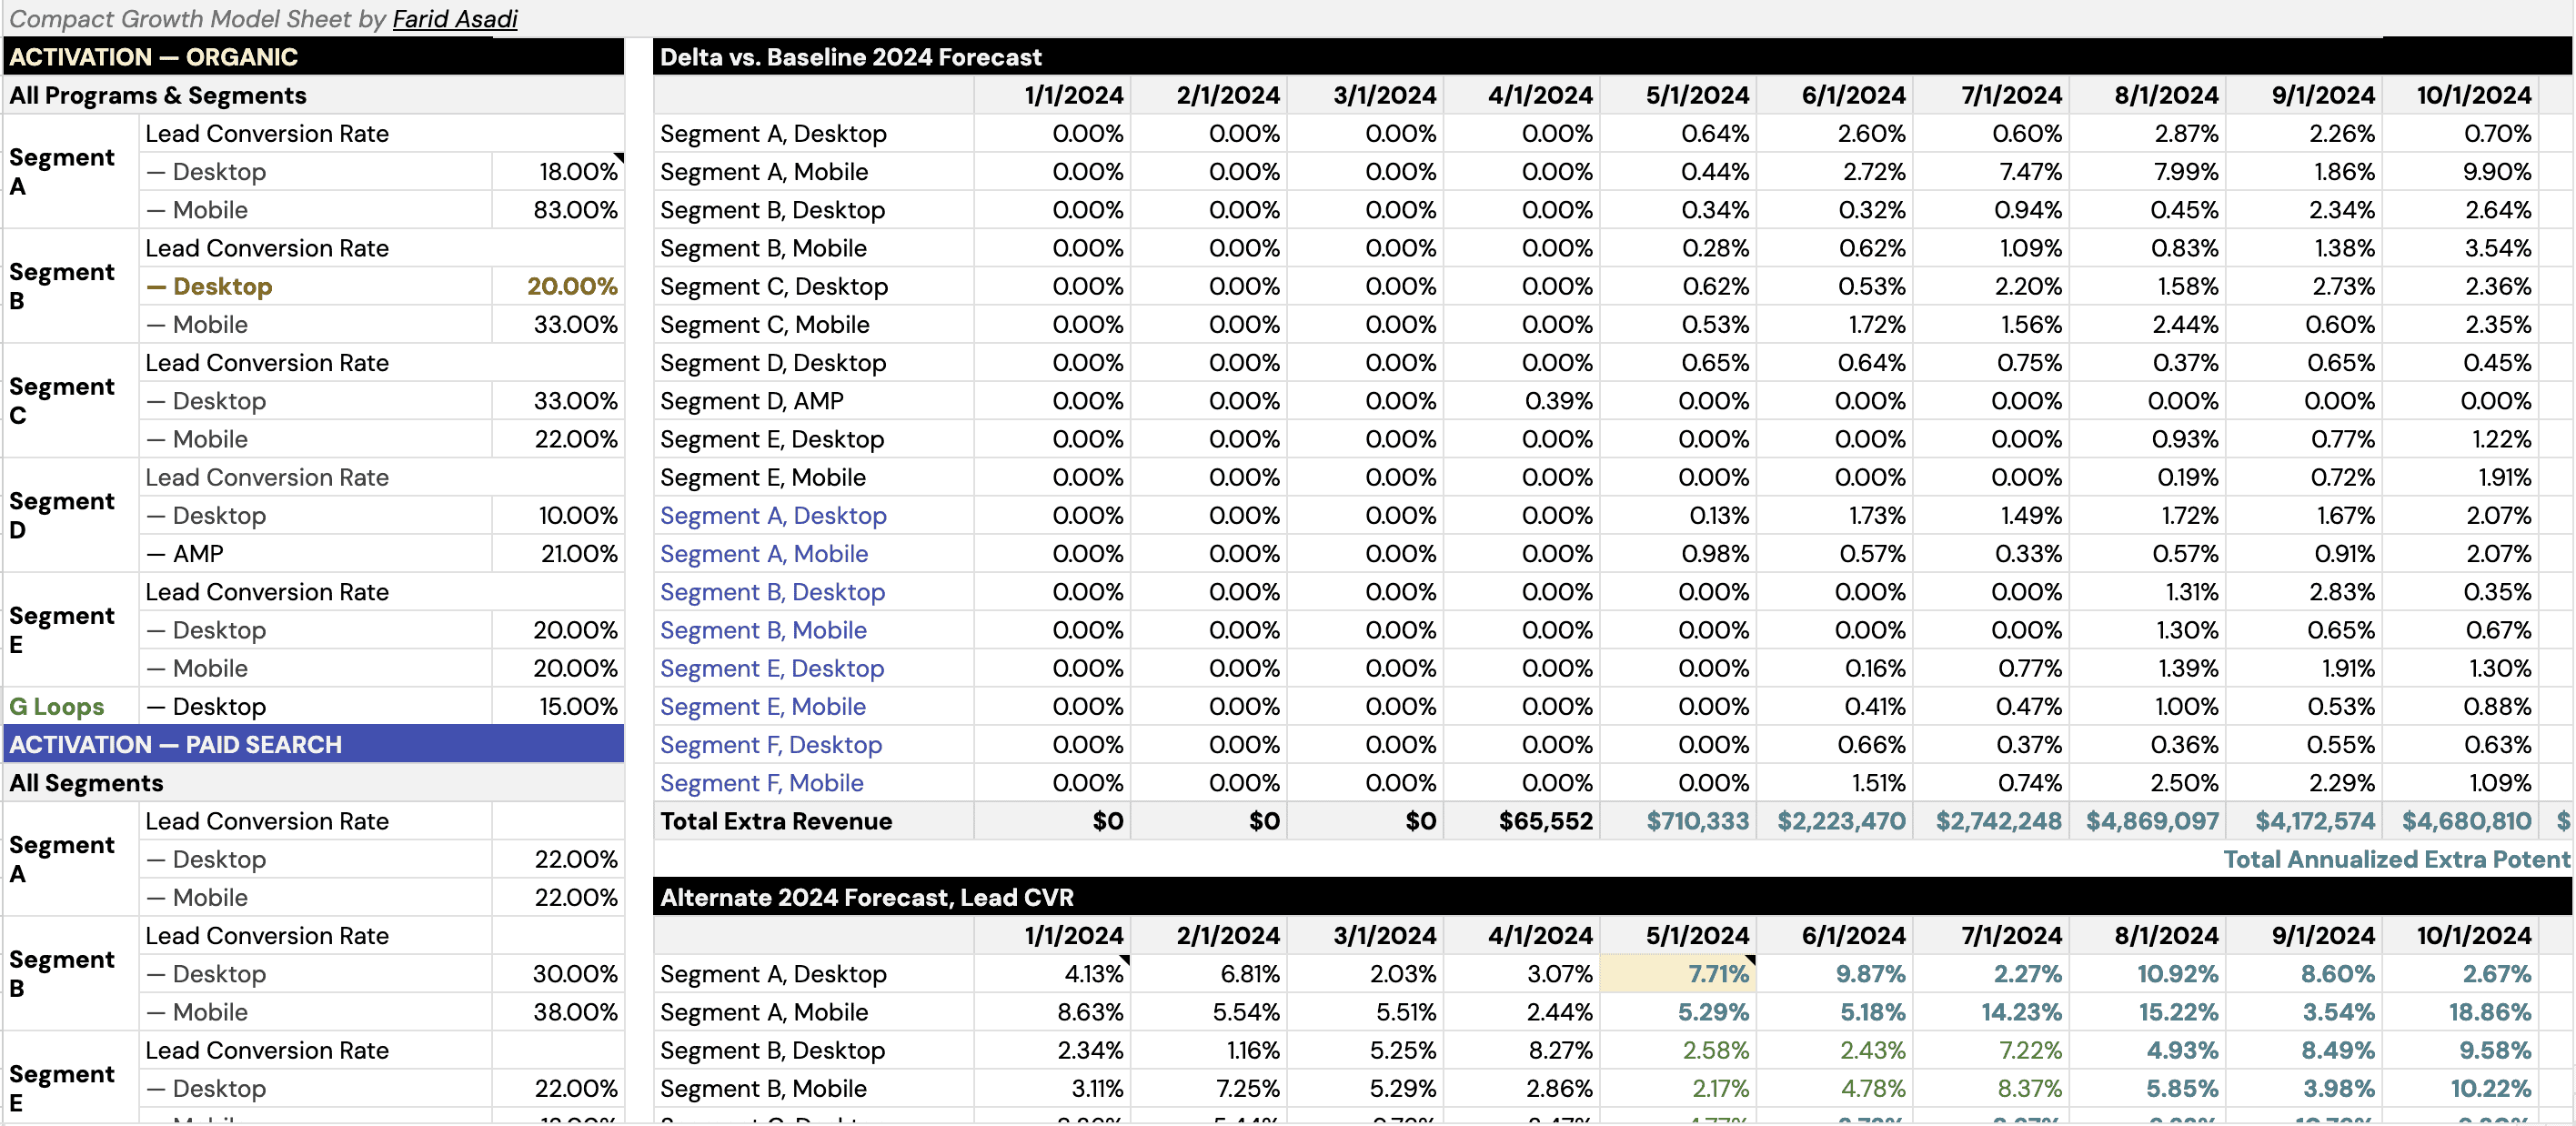
1. Identifying and Segmenting Growth Elements. Start by dissecting your growth engines. We divided ours into channels (organic and paid), growth funnel stages (acquisition, activation, retention, etc.), page types, and device categories. This segmentation may evolve as your understanding of your business deepens. Remember, the more granular your segmentation, the more control you have over your growth strategies. Here, I focus on activation via two key channels, Organic and Paid Search, keeping the analysis high-level rather than detail-oriented.
2. Establishing Baselines and Forecasting. After breaking down your growth components, input last year’s data to establish a baseline. This historical data is your foundation for forecasting the upcoming year. Importantly, don’t hesitate to integrate your own formulas, particularly for nuanced metrics like retention. Tailoring these formulas to your unique business context ensures a more accurate and meaningful forecast.
Additionally, when forecasting, consider past changes and their impacts. For example, if you introduced a new feature last year that significantly boosted conversion rates, this should be reflected in your projections.
3. Creating an Alternate Scenario. Time to play. Modify your assumptions, like lead values at the bottom, define your targets on the left side, and outline the timeline for your programs’ implementation in the alternate table. In my case, I’ve assigned targets to specific months according to my timeline and highlighted them for clarity. It’s fascinating to see how these changes can paint a different picture of your potential growth. Align these with your strategic timeline to ensure they’re realistic and achievable.
4. Sensitivity Analysis for Identifying Growth Levers. The sensitivity analysis is always an eye-opener. It helped identify which elements had the greatest impact on our growth. By tweaking different variables (time and target here), you can see which strategies are worth investing more time and resources into. This part of the sheet becomes your playground for strategic experimentation.
Now that you’ve input the alternative table numbers, you can observe the Delta values. These figures reveal the monthly and annual contribution of your programs, including an annualized estimate calculated as the final month’s contribution multiplied by 12.
Enjoyed this template? Feel free to check out Brand Preference Map Template; it guides you on how to powerfully establish brand preference amid your competition.